Commute Time by Neighborhood

code
Published

June 14, 2024

Intro

Our neighborhood is in a suburb of Houston that is just off of a major highway that many people use for commuting. It’s a convenient place to either commute North into Houston or South to Lake Jackson. One reason we picked our house was its close proximity to the highway - I can be on the highway headed to work in about 5 minutes. But I’ve noticed it sometimes takes me 10 minutes just to go from my house to another house in the same community. So folks in other neighborhoods likely take significantly longer to get to and from the highway. The goal of the exercise below was to quantify the commuter convenience of my house.

Data preparation - This includes gathering addresses and using Bing Maps API to determine commute times.

Code
import pandas as pd
import requests
import pickle
import os.path
import json
import time
from tqdm import tqdm
import numpy as np

import seaborn as sns
from pathlib import Path
# import plotly.express as px

adds_df_path = Path("adds_df.parquet")
if not adds_df_path.exists():
    # Pulled a list of addresses for my community from county tax website
    cols_of_interest = [
        "prop_id",
        "hood_cd",
        "market",
        "school",
        "city",
        "county",
        "legal_desc",
        "tract_or_lot",
        "abs_subdv_cd",
        "situs_num",
        "situs_street",
        "situs_street_sufix",
        "situs_city",
        "situs_state",
        "situs_zip",
        "addr_line1",
        "addr_line2",
        "addr_line3",
        "addr_city",
        "addr_state",
        "zip",
    ]

    adds_df = pd.read_excel("address_list.xlsx")
    adds_df = adds_df[cols_of_interest]

    # Clean up all of the columns that contain property address data
    # ['situs_num', 'situs_street', 'situs_street_sufix', 'situs_city', 'situs_state', 'situs_zip']

    adds_df["situs_num"] = adds_df["situs_num"].fillna(0)
    adds_df["situs_street"] = adds_df["situs_street"].fillna("")
    adds_df["situs_street_sufix"] = adds_df["situs_street_sufix"].fillna("")
    adds_df["situs_city"] = adds_df["situs_city"].fillna("Pearland")
    adds_df["situs_state"] = adds_df["situs_state"].fillna("TX")
    adds_df["situs_zip"] = adds_df["situs_zip"].fillna("77584")

    adds_df["situs_num"] = adds_df["situs_num"].apply(lambda x: str(int(x)))
    adds_df["situs_street"] = adds_df["situs_street"].apply(lambda x: str(x).strip())
    adds_df["situs_street_sufix"] = adds_df["situs_street_sufix"].apply(
        lambda x: str(x).strip()
    )
    adds_df["situs_city"] = adds_df["situs_city"].apply(lambda x: str(x).strip())
    adds_df["situs_state"] = adds_df["situs_state"].apply(lambda x: str(x).strip())
    adds_df["situs_zip"] = adds_df["situs_zip"].apply(lambda x: str(int(x)))

    # Create new columns to construct full address which will be used in Bing Maps searches
    adds_df.insert(0, "house_address_partial", "", allow_duplicates=False)
    adds_df.insert(0, "house_address", "", allow_duplicates=False)

    # populate new columns for creating full address
    adds_df["house_address_partial"] = (
        adds_df["situs_num"]
        + " "
        + adds_df["situs_street"]
        + " "
        + adds_df["situs_street_sufix"]
    )
    adds_df["house_address"] = (
        adds_df["house_address_partial"]
        + ", "
        + adds_df["situs_city"]
        + ", "
        + adds_df["situs_state"]
        + " "
        + adds_df["situs_zip"]
    )

    adds_df["prop_id"] = adds_df["prop_id"].apply(lambda x: int(x))
    adds_df = adds_df.set_index("prop_id")

    # testPropid = adds_df.index[0]
    # testAddress = adds_df["house_address"].iloc[0]
    # print([testPropid, testAddress])

    with open("secrets.pickle", "rb") as f:
        secrets = pickle.load(f)

    # Route payloads contains details for 4 different navigational routes:
    # 1) morning Northbound (AM-N) and 2) its afternoon counterpart (PM-N)
    # 3) morning Southbound (AM-S) and 4) its afternoon counterpart (PM-S)
    # I had to make afternoon times as arrival or else api didn't successfully respond
    route_payloads = {
        "AM-N": {
            "wp.1": "29.595583, -95.386315",
            "dateTime": "11/08/2023 08:00:00",
            "timeType": "Departure",
        },
        "PM-N": {
            "wp.0": "29.594770, -95.386830",
            "dateTime": "11/08/2023 17:30:00",
            "timeType": "Arrival",
        },
        "AM-S": {
            "wp.1": "29.549921, -95.387785",
            "dateTime": "11/08/2023 08:00:00",
            "timeType": "Departure",
        },
        "PM-S": {
            "wp.0": "29.543948, -95.387128",
            "dateTime": "11/08/2023 17:30:00",
            "timeType": "Arrival",
        },
    }

    def bing_maps_query(house_address, route_payload):
        my_api_key = secrets["api_key"]
        bing_map_url = r"http://dev.virtualearth.net/REST/V1/Routes/Driving"
        payload = {
            "avoid": "tolls",
            "key": my_api_key,
            "distanceUnit": "mi",
            "travelMode": "Driving",
            "optimize": "timeWithTraffic",
        }
        payload = payload | route_payload

        if "wp.0" in payload.keys():
            payload["wp.1"] = house_address
        else:
            payload["wp.0"] = house_address

        r = requests.get(
            "http://dev.virtualearth.net/REST/V1/Routes/Driving", params=payload
        )
        return r

    def format_response_filepath(propid, descriptor):
        subfolder = "query_responses"
        response_filename = str(propid) + "|" + descriptor + ".pickle"
        response_path = Path(__file__).parent / subfolder / response_filename
        return response_path

    # get routes for all addresses
    propid_subset = list(adds_df.index)

    # add columns for route drive distances and times
    new_col_initialVals = {
        "travelDistance": 0.0,
        "distanceUnit": "",
        "travelDuration": 0,
        "travelDurationTraffic": 0,
        "durationUnit": "",
    }
    new_columns = {
        "|".join([route, col]): new_col_initialVals[col]
        for col in new_col_initialVals
        for route in route_payloads
    }
    for col in new_columns:
        adds_df.insert(1, col, new_columns[col], allow_duplicates=False)

    # add columns for address latitude/longitude
    adds_df.insert(1, "lon", 0.0, allow_duplicates=False)
    adds_df.insert(1, "lat", 0.0, allow_duplicates=False)

    # loop through property ID / addresses.
    # Check if we've already saved the route info, otherwise query maps API and save the response
    for propid in tqdm(propid_subset):
        prop_address = adds_df.loc[propid]["house_address"]
        for route in route_payloads:
            prop_route_filepath = format_response_filepath(propid, route)
            if prop_route_filepath.exists():
                with open(prop_route_filepath, "rb") as f:
                    r = pickle.load(f)
            else:
                r = bing_maps_query(prop_address, route_payloads[route])
                with open(prop_route_filepath, "wb") as f:
                    pickle.dump(r, f)
            # Extract some data from good responses
            if r.json()["statusCode"] == 200:
                route_data = r.json()["resourceSets"][0]["resources"][0]
                result_keys = {
                    "travelDistance": float,
                    "distanceUnit": str,
                    "travelDuration": int,
                    "travelDurationTraffic": int,
                    "durationUnit": str,
                }
                # get results of interest, cast into proper data types, insert into df
                results = {
                    key: result_keys[key](route_data[key]) for key in result_keys
                }
                new_columns = ["|".join([route, key]) for key in result_keys]
                adds_df.loc[propid, new_columns] = [results[key] for key in results]
                # get latitude/longitude
                if route.startswith("AM"):
                    adds_df.loc[propid, ["lat", "lon"]] = route_data["routeLegs"][0][
                        "startLocation"
                    ]["point"]["coordinates"]

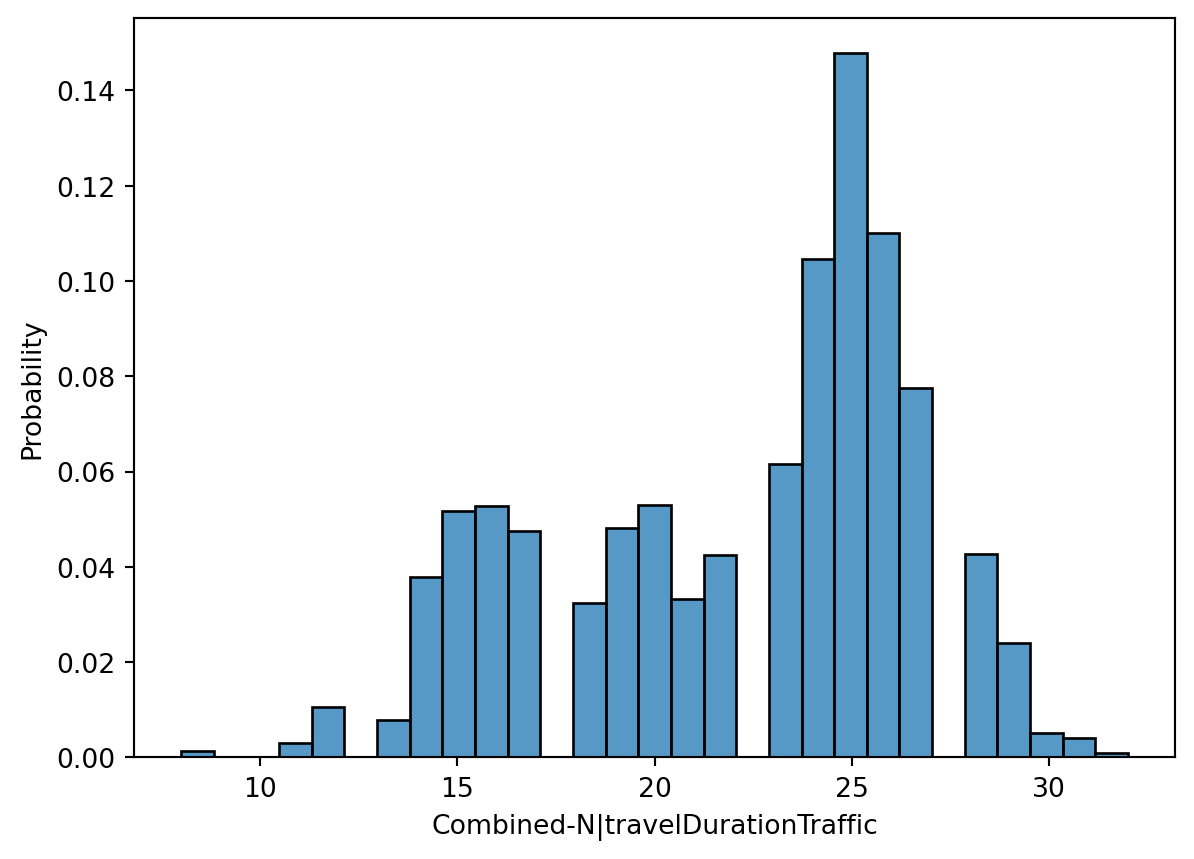
    adds_df["Combined-N|travelDurationTraffic"] = np.round(
        (adds_df["AM-N|travelDurationTraffic"] + adds_df["PM-N|travelDurationTraffic"])
        / 60
    )
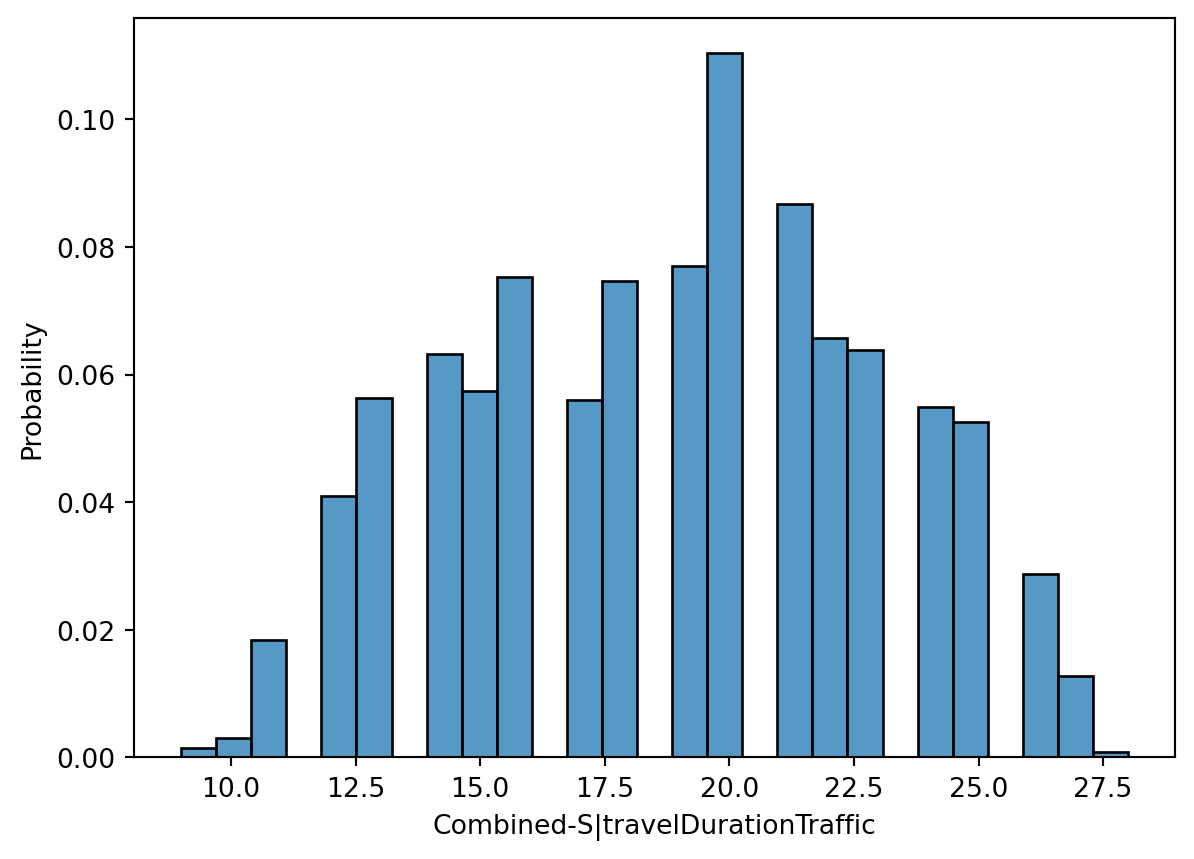
    adds_df["Combined-S|travelDurationTraffic"] = np.round(
        (adds_df["AM-S|travelDurationTraffic"] + adds_df["PM-S|travelDurationTraffic"])
        / 60
    )
    adds_df = adds_df.astype({"tract_or_lot": str})
    adds_df.to_parquet(adds_df_path)
else:
    adds_df = pd.read_parquet(adds_df_path)

Map configuration

Code
from shapely.geometry import MultiPoint
import folium
import geopandas as gpd

# filter out some unintentional properties on south 
adds_df_subset = adds_df[adds_df['lat'] > 29.5550]
# adds_df_subset.head(2)

avg_hood_df = adds_df_subset[['hood_cd','Combined-N|travelDurationTraffic','Combined-S|travelDurationTraffic','market']].groupby('hood_cd').mean().copy().reset_index(drop=False)
# avg_hood_df.head(2)

hoods_geometry = [MultiPoint(adds_df_subset[adds_df_subset['hood_cd']==hood][['lon','lat']].to_numpy()) for hood in avg_hood_df['hood_cd']]
hoods_gpd = gpd.GeoDataFrame(avg_hood_df,geometry=hoods_geometry,crs='EPSG:4326')
hoods_gpd['geometry'] = hoods_gpd['geometry'].concave_hull(ratio=0.25)
# hoods_gpd.head(2)

map_center = (29.566122784955606, -95.41278501301733)
min_lat, max_lat = 29.555, 29.582
min_lon, max_lon = -95.455, -95.386
home_latlon = (29.562541, -95.398825)

Houston Commuters

The map below shows the average time for each neighborhood to get to and from the highway during commuting hours when commuting northbound to Houston.

Code
m_nb = folium.Map(
    max_bounds=True,
    # zoom_control=False,
    location=map_center,
    min_zoom=12,
    zoom_start=14,
    max_zoom=16,
    # min_lat=min_lat,
    # max_lat=max_lat,
    # min_lon=min_lon,
    # max_lon=max_lon,
)

folium.Marker(
    location=home_latlon,
    icon=folium.Icon(icon="home"),
).add_to(m_nb)

folium.Choropleth(
    geo_data=hoods_gpd,
    data=hoods_gpd,
    name="choropleth",
    columns=["hood_cd", "Combined-N|travelDurationTraffic"],
    key_on="feature.properties.hood_cd",
    fill_color="OrRd",
    fill_opacity=0.7,
    line_opacity=0.2,
    legend_name="Northbound - Daily travel time to/from highway (minutes)",
).add_to(m_nb)

# add this to improve viewing on mobile
m_nb.get_root().header.add_child(
    folium.Element(
        '<meta name="viewport" content="width=device-width,'
        ' initial-scale=1.0, maximum-scale=1.0, user-scalable=no" />'
    )
)

m_nb
Make this Notebook Trusted to load map: File -> Trust Notebook


A histogram of the daily commute time for Houston / northbound commuters.

Code
temp_route = "Combined-N|travelDurationTraffic"
sns.histplot(adds_df[adds_df[temp_route] > 1], x=temp_route, stat="probability")

Lake Jackson / Freeport Commuters

The map below shows the average time for each neighborhood to get to and from the highway during commuting hours when commuting southbound to Lake Jackson. This is the direction I commute.

Code
m_sb = folium.Map(
    max_bounds=True,
    # zoom_control=False,
    location=map_center,
    min_zoom=12,
    zoom_start=14,
    max_zoom=16,
    # min_lat=min_lat,
    # max_lat=max_lat,
    # min_lon=min_lon,
    # max_lon=max_lon,
)

folium.Marker(
    location=home_latlon,
    icon=folium.Icon(icon="home"),
).add_to(m_sb)

folium.Choropleth(
    geo_data=hoods_gpd,
    data=hoods_gpd,
    name="choropleth",
    columns=["hood_cd", "Combined-S|travelDurationTraffic"],
    key_on="feature.properties.hood_cd",
    fill_color="OrRd",
    fill_opacity=0.7,
    line_opacity=0.2,
    legend_name="Soutbound - Daily travel time to/from highway (minutes)",
).add_to(m_sb)

# add this to improve viewing on mobile
m_sb.get_root().header.add_child(
    folium.Element(
        '<meta name="viewport" content="width=device-width,'
        ' initial-scale=1.0, maximum-scale=1.0, user-scalable=no" />'
    )
)

m_sb
Make this Notebook Trusted to load map: File -> Trust Notebook


A histogram of the daily commute time for Lake Jackson / southbound commuters.

Code
temp_route = "Combined-S|travelDurationTraffic"
sns.histplot(adds_df[adds_df[temp_route] > 1], x=temp_route, stat="probability")

Conclusion

The figures above show that my neighborhood is one of the best with respect to commute times. From my neighborhood it takes roughly 6 minutes to get to the highway in the morning and 6 minutes to get to my house from the highway in the afternoon – a combined 12 minutes per day. Many neighborhoods are twice that!

Extrapolating those numbers to a whole year means if I commute 5 days a week x 50 weeks a year, I’m in my car for 2 days worth of time per year just going to and from the highway. Some of the neighborhoods west of me spend 4 days per year in their car just getting to and from the highway.